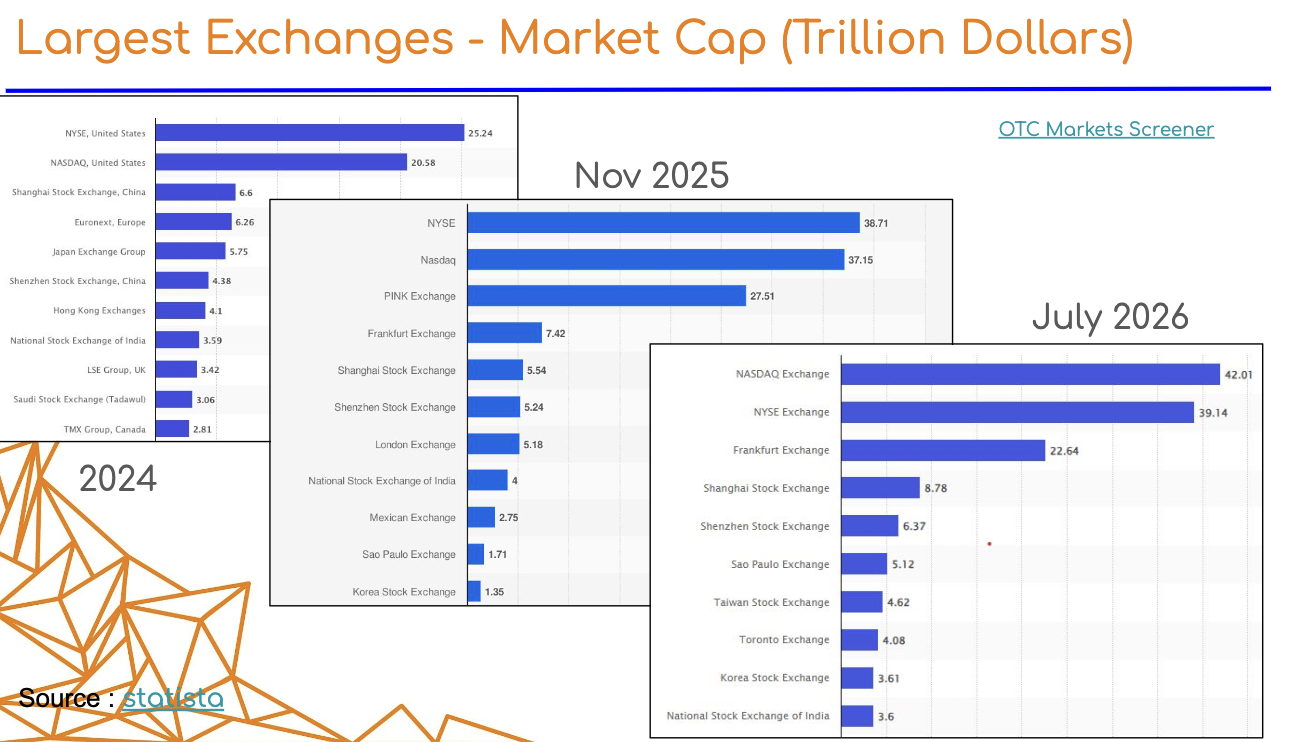
Exchange
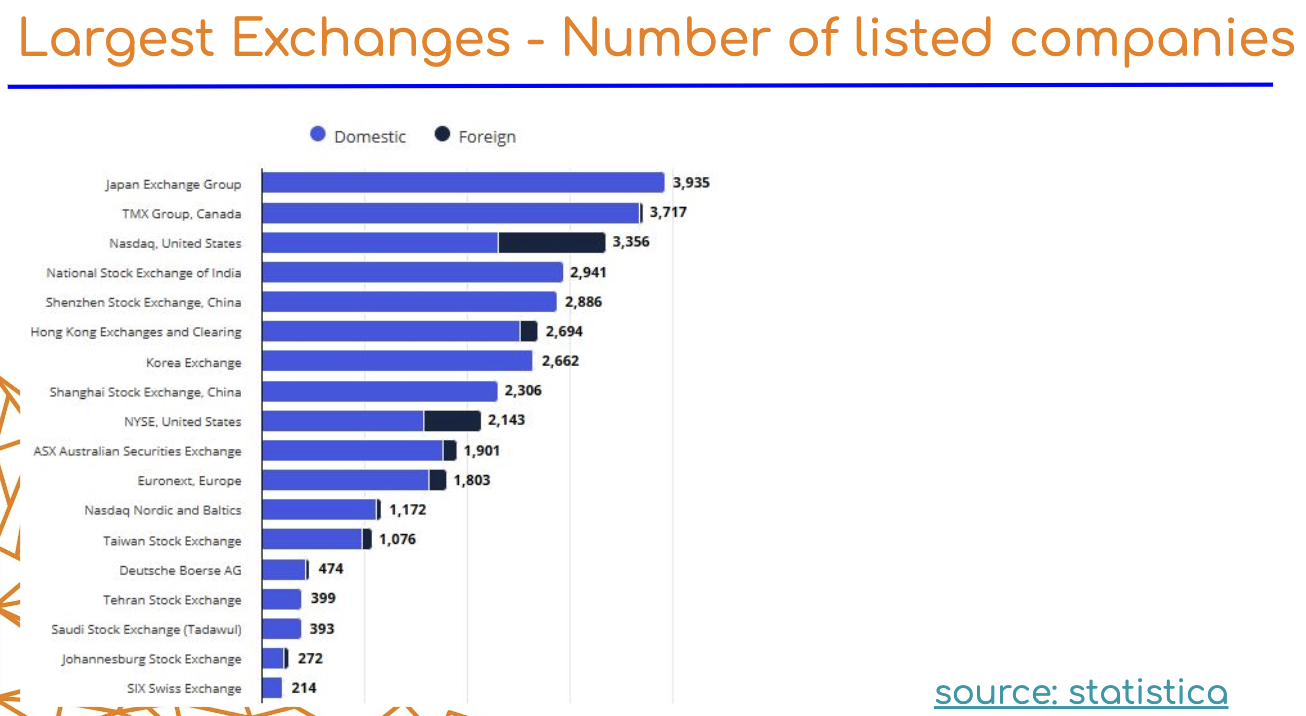
- marketplace where buyers and sellers make transactions
- the instrument must be listed in Exchange
- the instrument should meet a specific criteria to be listed
- confidence to investors
- stability of the system
- types:
- Centralised - Stocks (SGX, NYSE)
- OTC - Forex
- CEX and DEX - Crypto (Binance, UniSwap, PancakeSwap etc.)
Index Calculations
- understand how markets / benchmarks are measured
- different calculations give different pictures of the same market
- see why some stocks affect an index more than others
- improve portfolio analysis skills
- traders / investors compare performance against a benchmark
- evaluate performance against the correct benchmark
Exchange Index
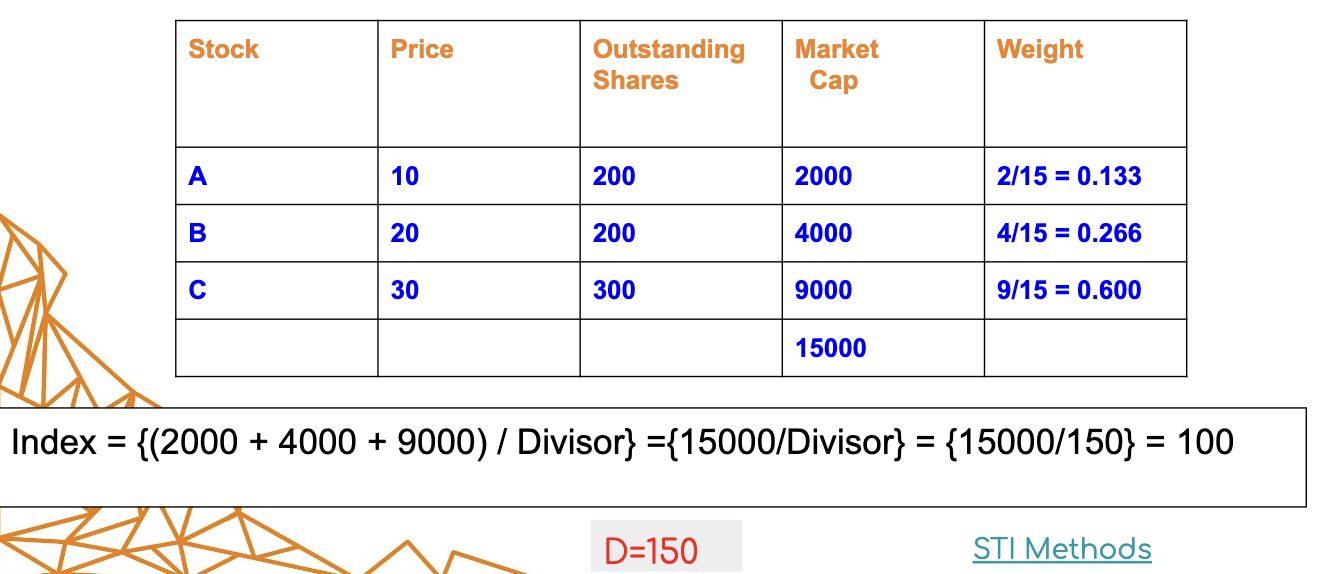
- Market Cap-Weighted Method
- Equal Weighted Method
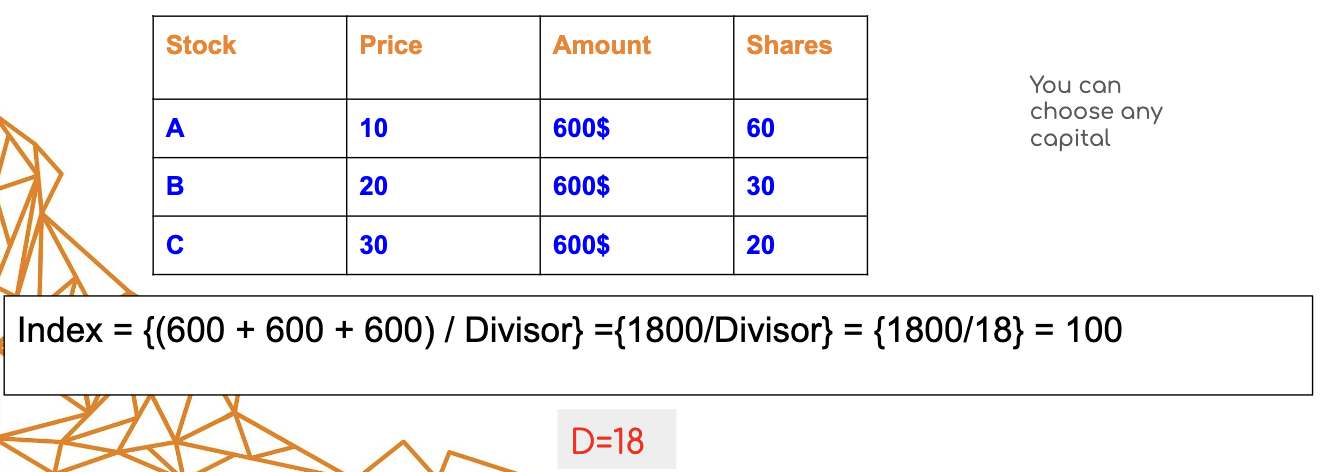
- similar to previous method but equal weights to each stock
- assume investing same amount of money to each stock
- weight = 33.3%, 33.3%, 33.3%
- Price Weighted Method
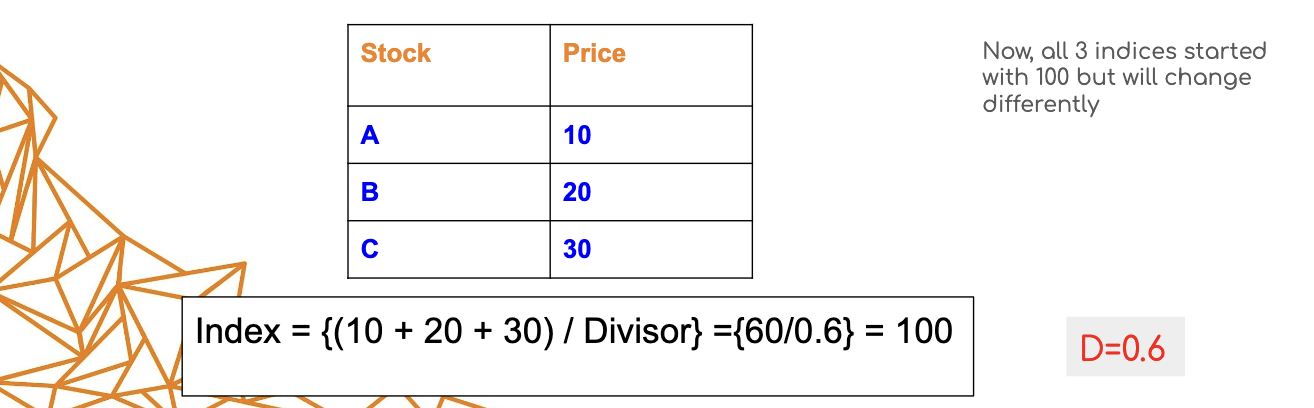
- simple arithmetic average prices of all stocks
- easiest method in calculation
- dow jones index
- weight =
- 10 / 60 = 16.7%
- 20 / 60 = 33.3%
- 30 / 60 = 50%
understanding the methods:
- all 3 use the same formula: Index = (sum of something) / Divisor
- only the “something” changes: market caps / equal $ amounts / raw prices
- the Divisor is not meaningful
- reverse-engineered so the index starts at a base value (here 100)
- 15000/150, 1800/18, 60/0.6 all = 100 by design
- real job comes later: adjusted on splits / index changes so the index doesn’t jump
- so the index level is arbitrary — only the % change matters
- what actually differs is the weights
| Stock | Market Cap | Equal | Price |
|---|---|---|---|
| A ($10, 200 sh) | 13.3% | 33.3% | 16.7% |
| B ($20, 200 sh) | 26.6% | 33.3% | 33.3% |
| C ($30, 300 sh) | 60.0% | 33.3% | 50.0% |
- market cap → weight by company size, biggest company dominates
- equal → weight by choice, size irrelevant; the $600 is arbitrary (any capital gives the same index)
- price → weight by share price only, high-priced stock dominates even if it’s a small company
- rule: % move in index = weight × % move in stock
- e.g. A doubles 20:
- market cap: 17000/150 = 113.3 (+13.3%)
- equal: 2400/18 = 133.3 (+33.3%)
- price: 70/0.6 = 116.7 (+16.7%)
- e.g. A doubles 20:
- same event, 3 different answers → the weighting scheme is the index
- hence benchmark choice matters when evaluating performance
Examples:
| Market Cap Weighted | Equal Weighted | Price Weighted |
|---|---|---|
| S&P 500 | S&P 500 Equal Weight Index (EWI) | Dow Jones Industrial Average (DJIA) |
| NASDAQ-100 | NASDAQ-100 Equal Weight Index | Nikkei 225 (Japan) |
| Russell 2000 | Russell 1000 Equal Weight Index | |
| MSCI World Index | Dow Jones Industrial Average Equal Weight | |
| FTSE 100 | ||
| DAX (Germany) |
Exchange Terminology
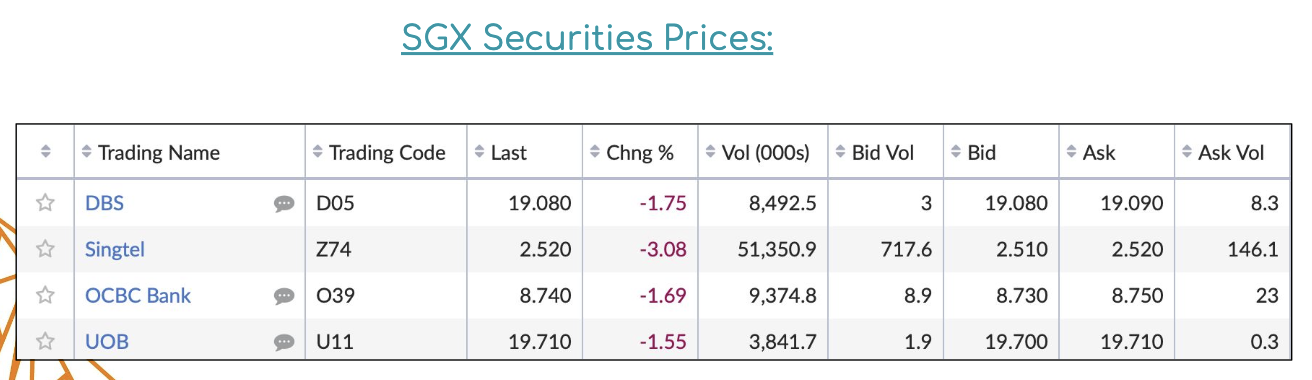
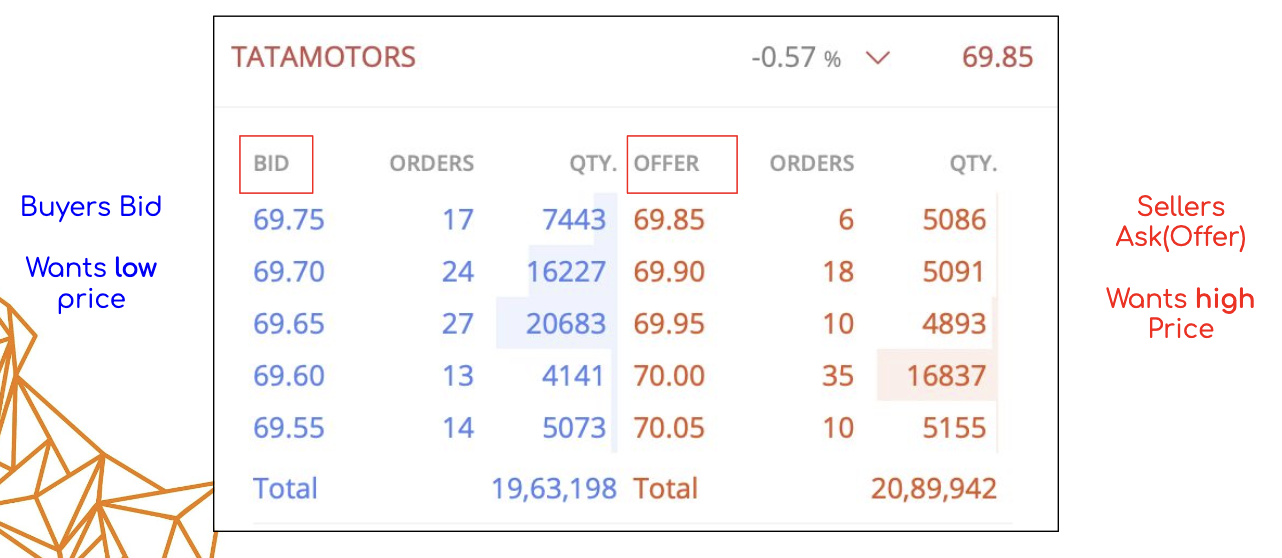
Bid-Ask and Order Matching
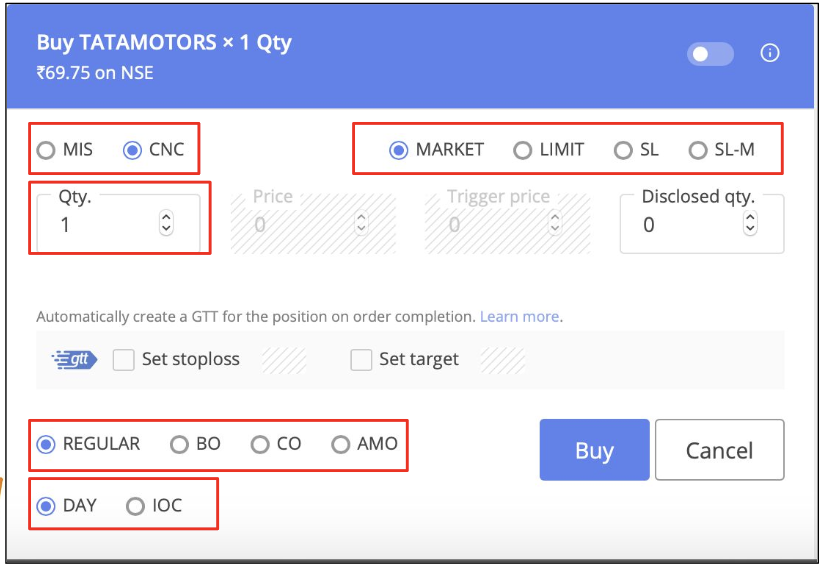
Order Types
Brokers
- intermediary between the traders / investors and the exchanges
- KYC
- different services including
- orders
- short selling
- leverage
- interactive brokers, WeBull, Oanda etc.
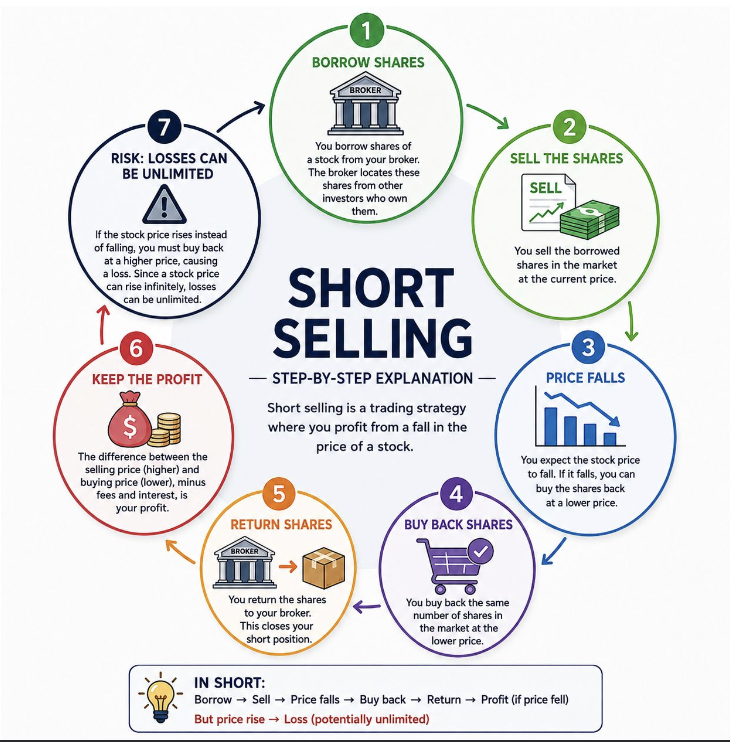
Short Sell
Leverage
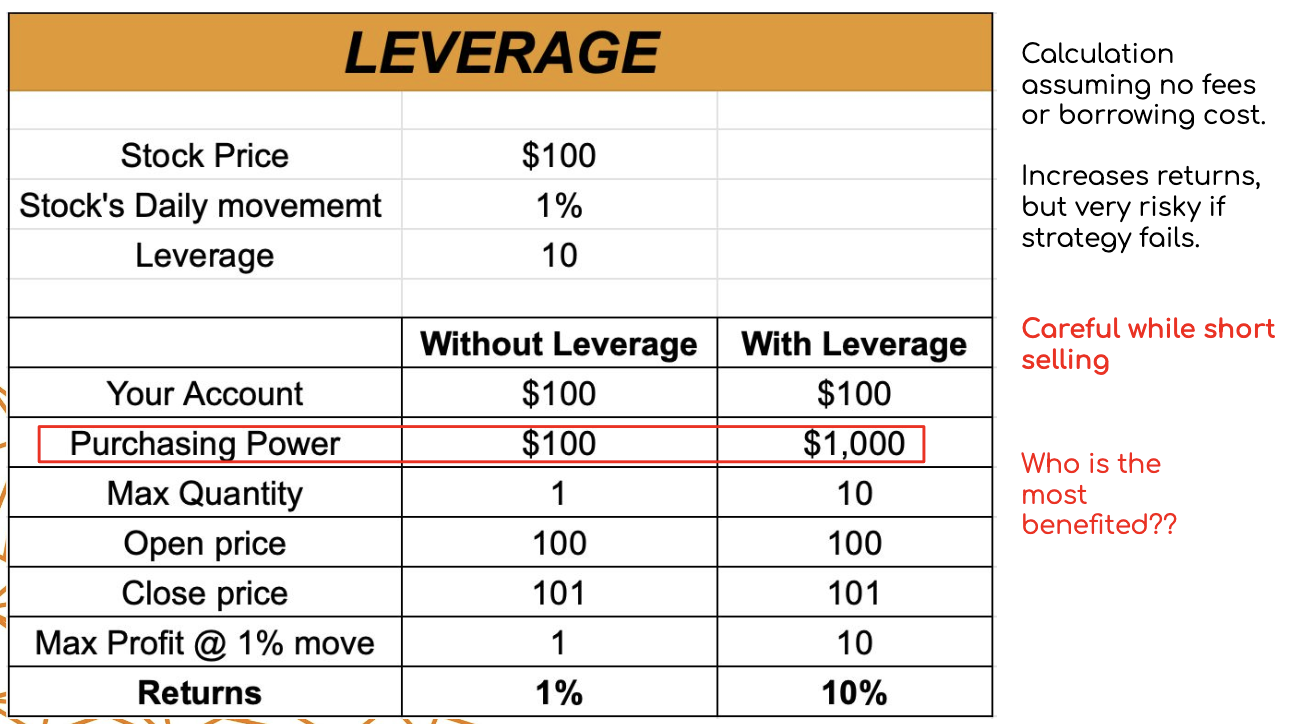
- leverage = using borrowed money to control a position bigger than your own cash
- leverage factor = position size / your own money (10x = 1 owned)
- margin = 1 / leverage → 10x = 10% margin
- purchasing power = your account × leverage = 100 × 10 = $1000
- your 900
- max quantity = purchasing power / stock price = 1000/100 = 10 shares
- stock price being $100 too is a coincidence of this example
- your return = leverage × the asset’s move
- stock moves 1% either way, but profit is on the full 100 → 10%
- multiplier on the outcome, not on the odds — losses scale identically
- −10% move at 10x wipes the account; broker liquidates (margin call) before that to protect their $900
- careful shorting: long loss is capped at 100% (stock → 0), short loss is unbounded (stock can rise forever)
- short + leverage → can owe more than you deposited
- most benefited = the broker
- interest on the loan + 10× the commission volume, no directional risk, holds your collateral
Predictions for Investing
Buy Low Sell High | Buy High Sell Higher | Buy Undervalued Sell Overvalued
- Technical Analysis - study of charts and past behaviour
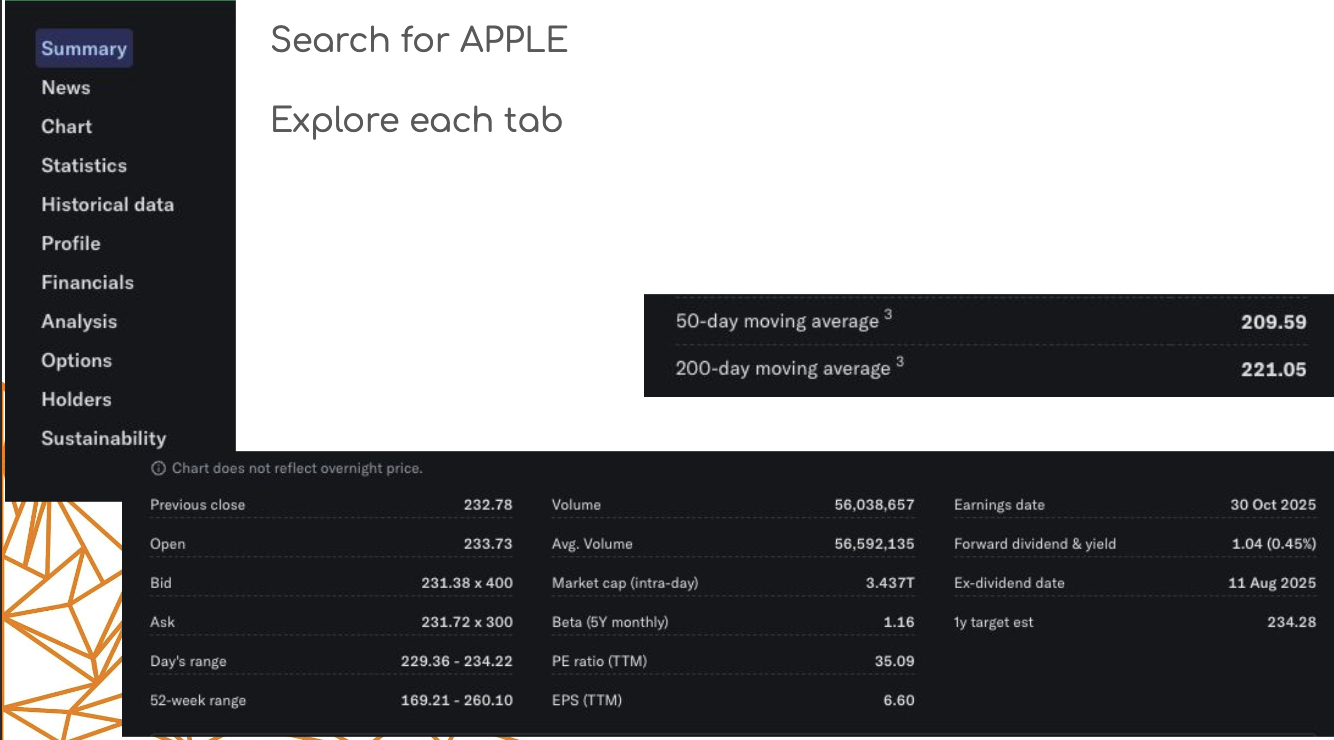
- technical indicators (50MA vs 200MA)
- wave theory
- history repeats itself
- Fundamental Analysis - finds the real value of stocks
- undervalued stocks (EPS and PE ratios)
- future expectations from a company
- Machine Learning - high computation to identify hidden patterns
- statistical models
- build models
- use of features and feature engineering to increase accuracy
- Time Series Analysis - DO NOT USE IN THIS MODULE
- statistical models (ARIMA, GARCH etc.)
Adaptive Market Hypothesis
- EMH - markets are efficient
- weak - technical
- semi strong - technical + fundamental
- strong - technical + fundamental + insider
- Behavioural Finance - trades / humans are irrational
- AMH - efficiency evolves and changes as participants and environment change
Investment Management
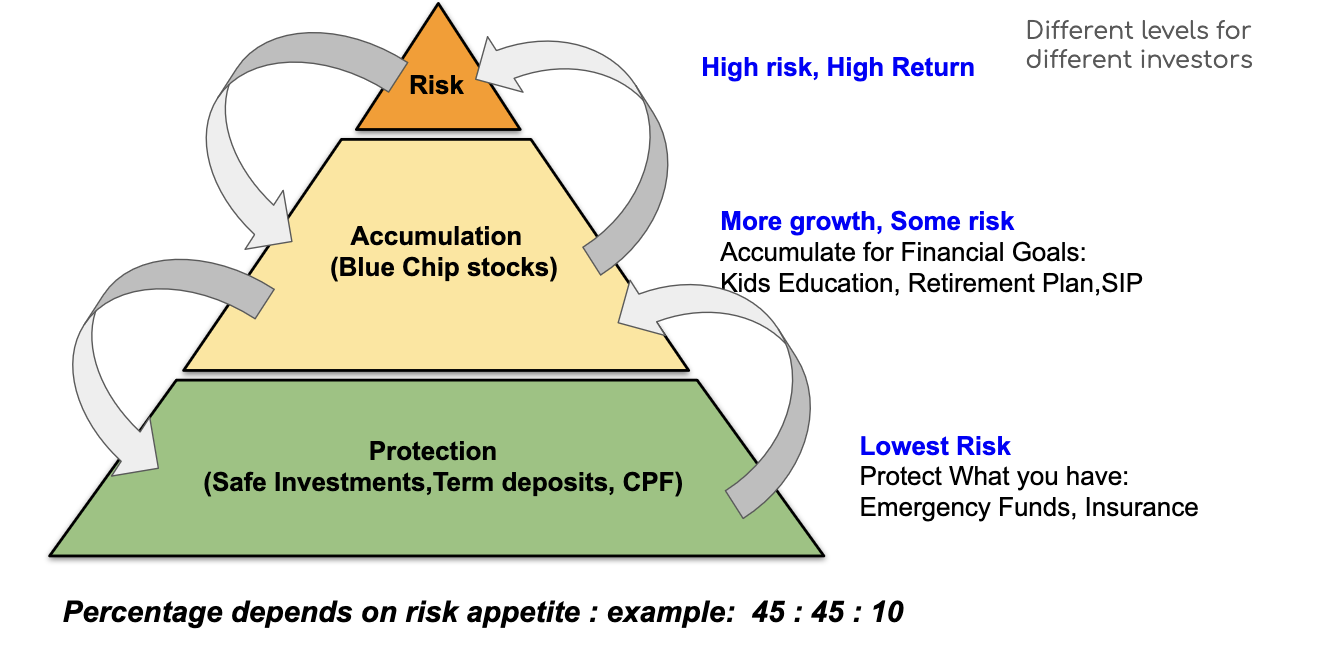
Investment Management Process
- different formats all over but the idea is the same
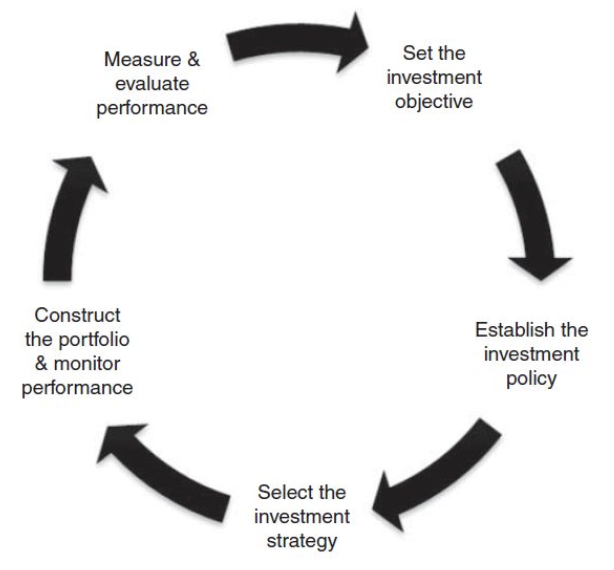
Steps for Trading (IDMR)
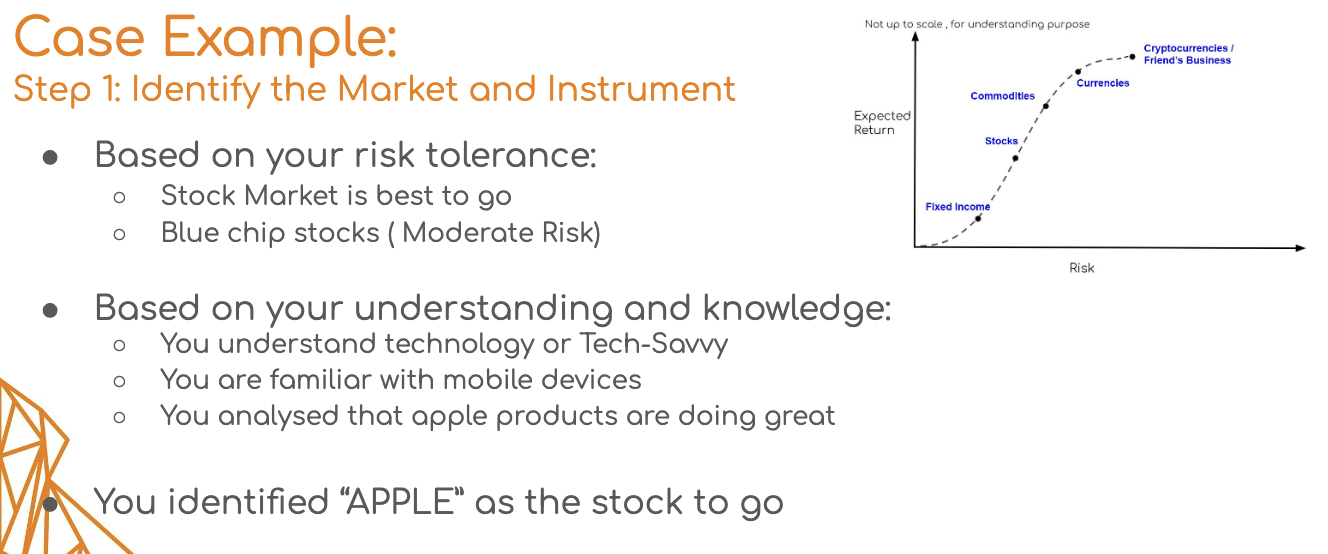
- Identify the market and instrument
- based on your risk tolerance and accessibility
- Decide
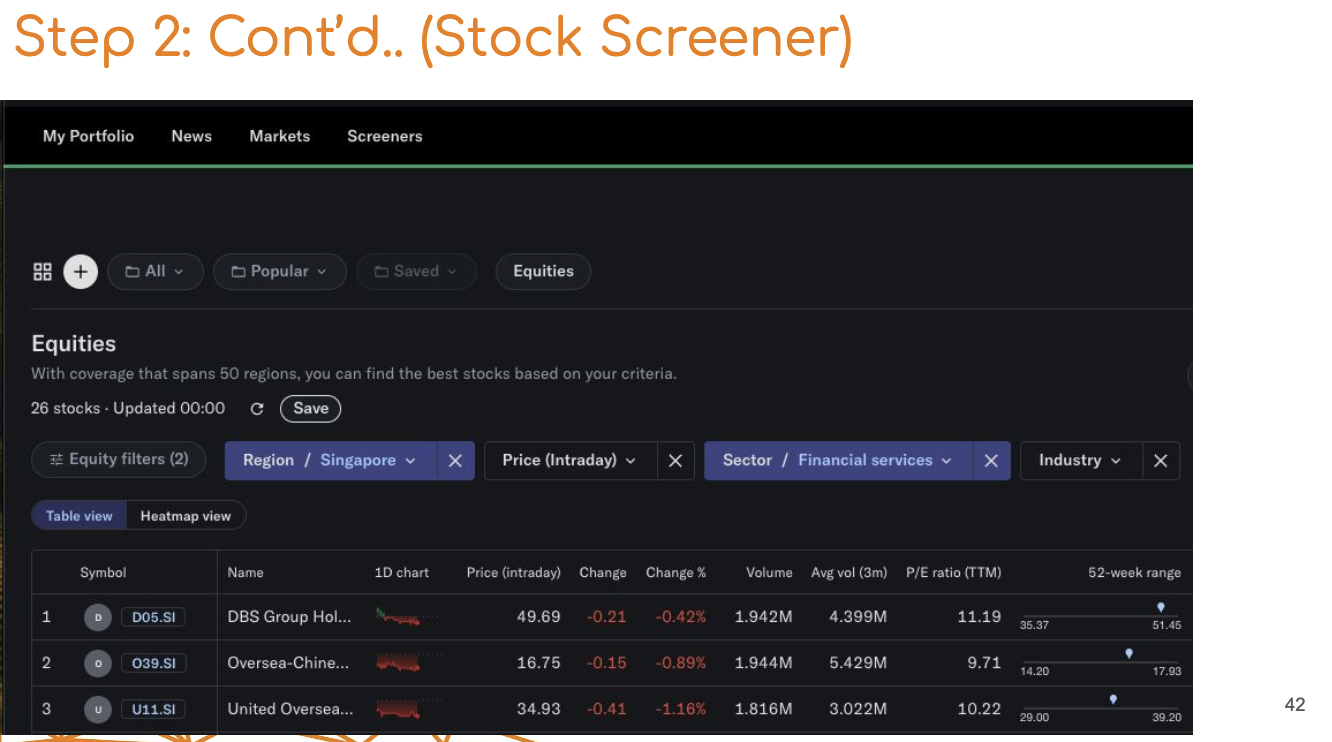
- buy or sell or hold (from yahoo finance, google finance, other strategies)
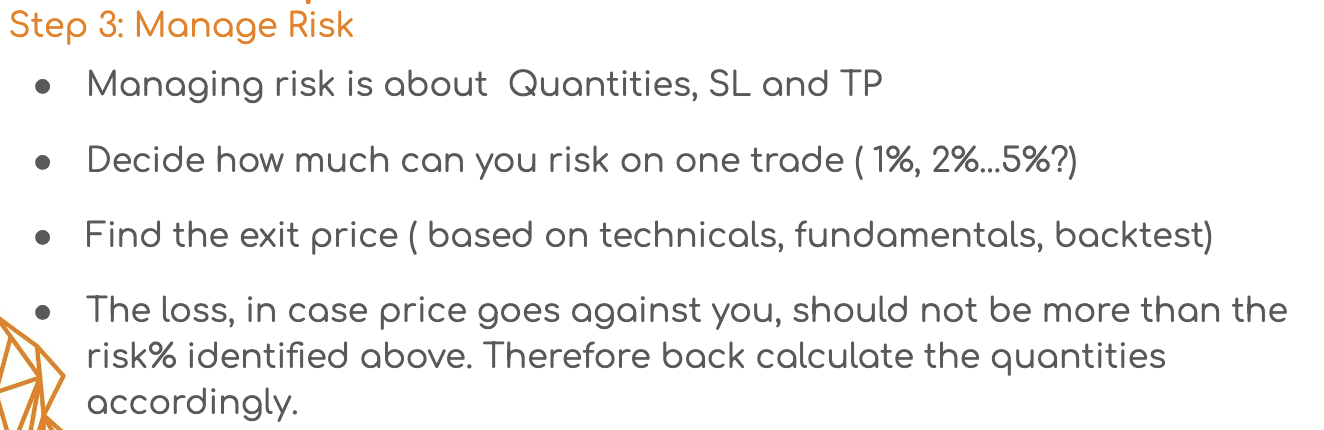
- Manage Risk
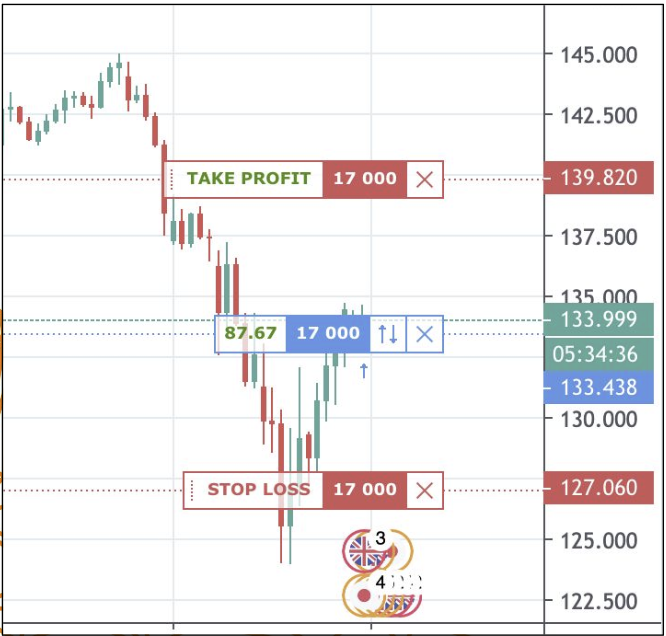
- stop loss, take profit
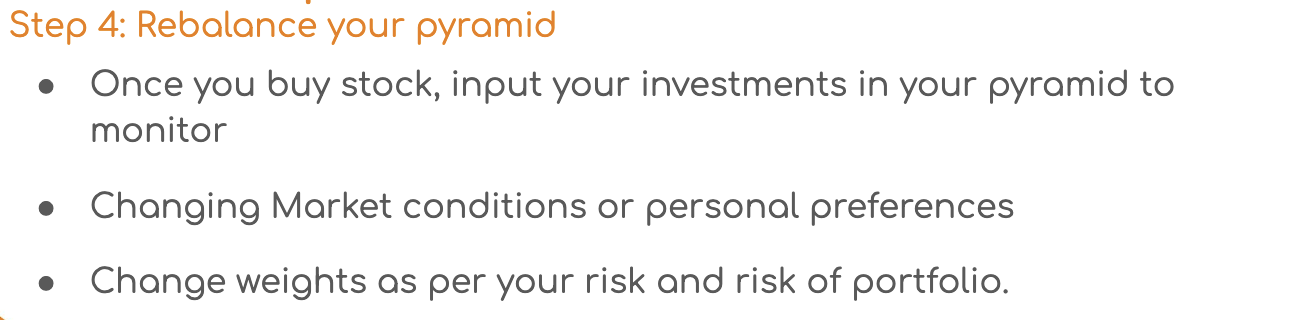
- Rebalance your pyramid / portfolio
Case Example:

Risk Reward Ratios
- risk management
- individual trade or portfolio
- stops based on supports / resistances, moving averages, indicators, portfolio value
- very important to be profitable in long run