What is TA?
- Study of Price Action
- prices and volumes
- mostly through charts and mathematical indicators
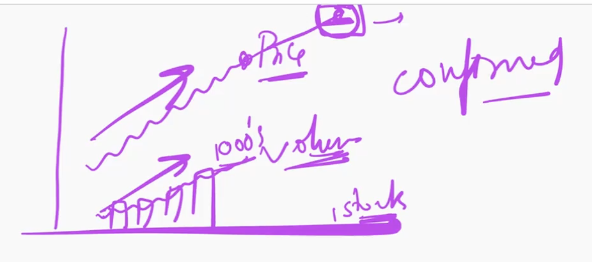
- open interest as well in case of Futures and Options
- zero sum game
- not dealing w this in this mod
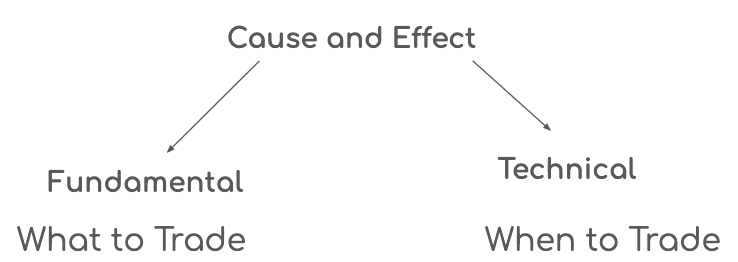
- established price action. doesn’t worry about the cause
Foundation of TA
- Premises
- Market Action discounts everything
- eventually, the technician is studying the fundamental of supply / demand
- there are reasons for the market movement, but knowing them is not good enough to predict
- Price moves in trend
- newton’s first law
- a trend is more likely to continue than to reverse
- uptrend / downtrend
- primary / secondary / minor or tertiary
- fractal behaviour
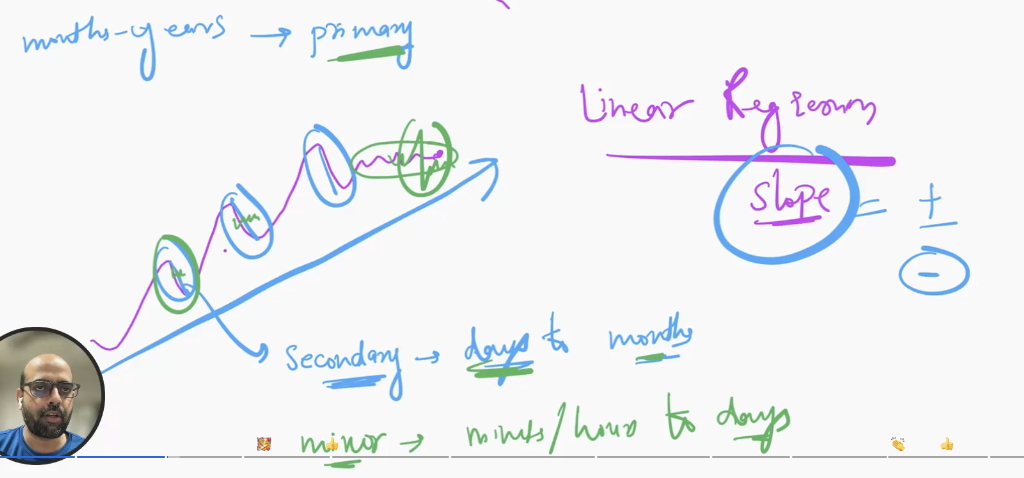
- Primary trend: overall market direction lasting from months to years; identify it visually or from the slope of a linear regression
- Secondary trend: a countertrend or mean-reverting movement within the primary trend, lasting from days to months
- Minor/tertiary trend: short-term fluctuations within the larger trends, lasting from minutes or hours to days
- A trend is expected to persist until an external force causes it to reverse; secondary and minor movements do not necessarily end the primary trend
- Trends are fractal:
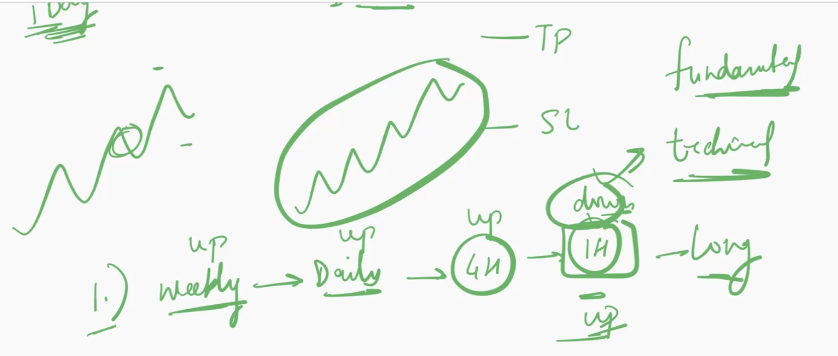
- similar patterns appear across different timeframes, but take-profit and stop-loss levels must be adjusted to the timeframe
- Use top-down confirmation: assess the weekly trend, then the daily, 4-hour and 1-hour charts; enter when the relevant timeframes align
- History repeats itself
- investor psychology
- people repeat the same action over time, hence the patterns
- patterns that used to occur a century ago, still occur at present
- analysts as chartists
- patterns are fractal
- Recurring chart patterns reflect recurring collective emotions and behaviour, particularly fear and greed
- A past pattern may recur, but it does not guarantee the future; trading decisions should therefore be probability-based and supported by risk management
- Apply technical analysis at any timeframe, while matching the stop-loss and take-profit distances to that timeframe
- For longer-term trades, work top-down from the weekly chart to the daily, 4-hour and 1-hour charts, and wait for the timeframes to confirm the same direction
- Market Action discounts everything
Applications of TA
- find the trend as early as possible and trade the trend
- trend is your friend, until it changes
- find trend by regression, visual approach or moving averages (momentum and mean reversion)
- sometimes - self-fulfilling prophecy
- you do, i do, we all do - emotional feedback and bubbles
- reason for various patterns
- understand false signals
- confirmations from indicators
- dow theory - averages
- confirm the trend from more than one source
- risk management
- target reasonable exists (TP / SL based on instrument)
- can be seen easily in historical data. however, risk management and behavioural issues block profits
Uptrend Downtrend Sideways
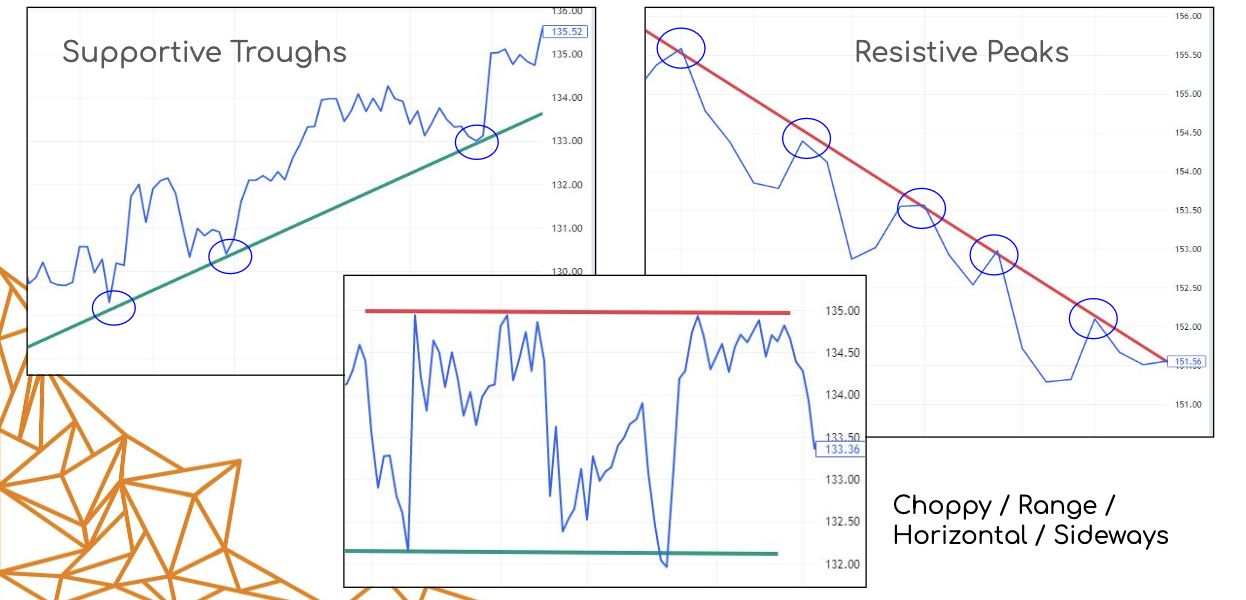
- Uptrend: successive higher highs and higher lows; draw the trendline by joining at least two supportive troughs
- Downtrend: successive lower highs and lower lows; draw the trendline by joining at least two resistive peaks
- Sideways/choppy market: neither an uptrend nor a downtrend; the highs and lows remain within roughly the same zones
- Two points establish a tentative trendline; later price action tests whether that support or resistance continues to hold
- A break of the trendline may indicate that the trend or its support/resistance level has shifted, so monitor and redraw it as new price action develops
- Trendlines involve some subjectivity; use a consistent method and chart timeframe
Dow Theory
- charles dow (co-founder of wall street journal) → william hamilton → robert rhea
- base of TA
- several tenets of dow theory
- the primary trend can’t be manipulated
- confirmation by averages
- DJIA
- DJTA
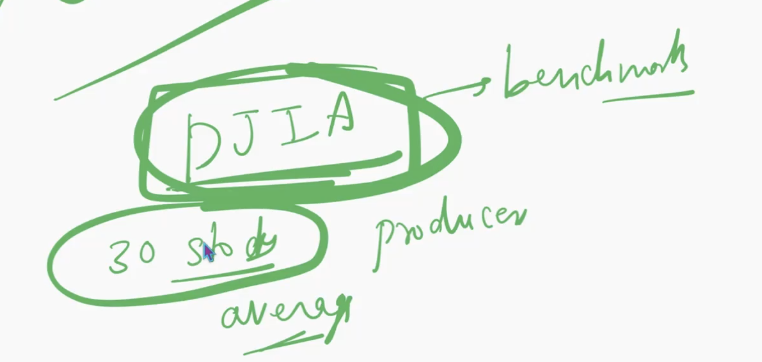
- DJIA: a price-weighted average of 30 major industrial stocks, representing the producers of goods and serving as a US market benchmark
- A rising DJIA suggests that the producing companies and the wider economy are performing well
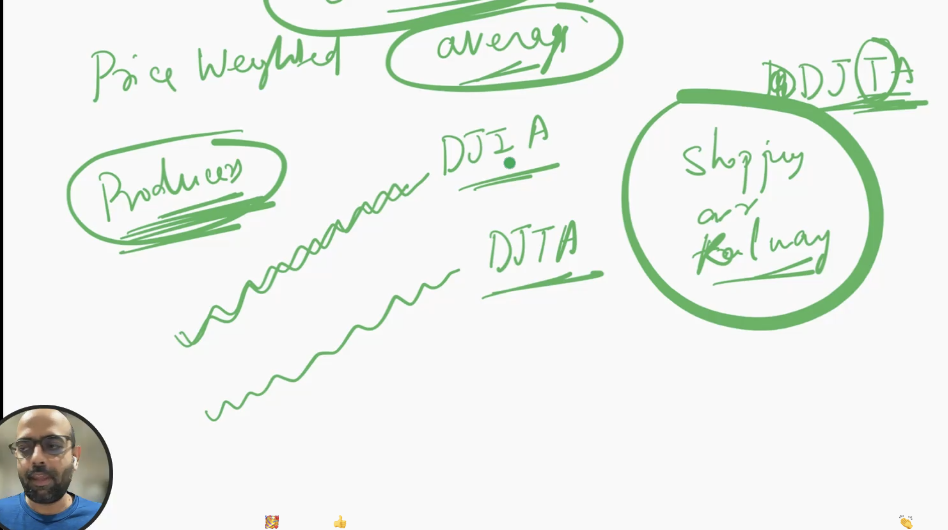
- A rising DJIA suggests that the producing companies and the wider economy are performing well
- DJTA: an average of major transport companies, such as shipping, railway and airline firms
- If producers are performing well and producing more goods, transport companies should also perform well because those goods must be delivered
- When both the DJIA and DJTA trend in the same direction, one average confirms the signal from the other
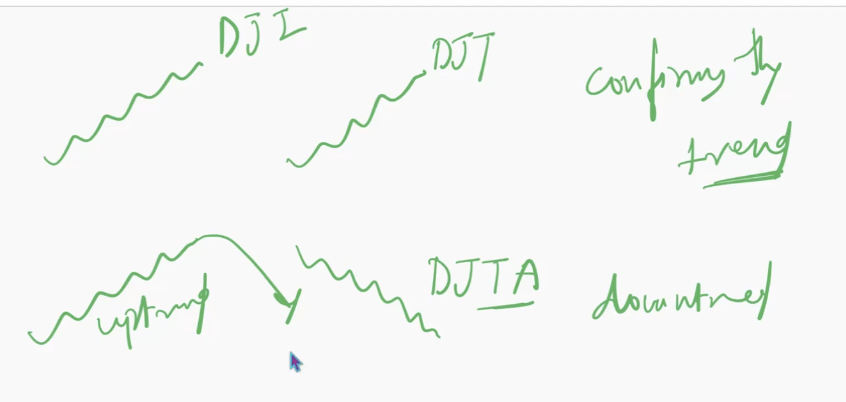
- If the DJIA rises while the DJTA falls, the trends diverge and the market signal is not confirmed
- In the absence of confirmation, stay out of the trade or wait for further evidence because a reversal may occur
- Confirmation reduces the number of trades taken, but improves their probability of success
- dow theory is not ‘absolutely’ trustworthy - be very careful, DYOR, proper risk management is needed all the time
Support and Resistances
- the human psychology (what will you do at point B?)
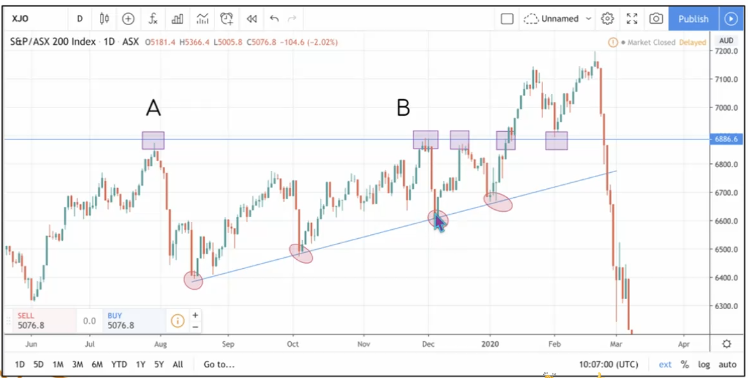
- Point A becomes a resistance level because the price previously failed to move above it and subsequently fell
- When the price returns to the same level at point B, three groups of traders create selling pressure:
- Traders who bought at A experienced losses and may sell at B once they return to break-even, driven by fear of another decline
- Traders who sold short at A previously profited and may sell short again, as the earlier fall confirms their bearish view
- Traders with no existing position may recognise the established resistance and open new short positions
- As all three groups are inclined to sell at B, the combined selling pressure increases the likelihood of another downward reversal
- Support and resistance therefore reflect traders’ memory, emotions and the resulting shifts in supply and demand
- After reversing at B, the price falls towards the existing support, rebounds, and may continue moving between the same support and resistance levels
- If traders eventually accept a price above the resistance, the resistance is broken, signalling a shift in supply and demand
- A broken resistance often becomes a new support; the price may return to retest that level before continuing upwards
- Similarly, when a support is broken, it may become a new resistance
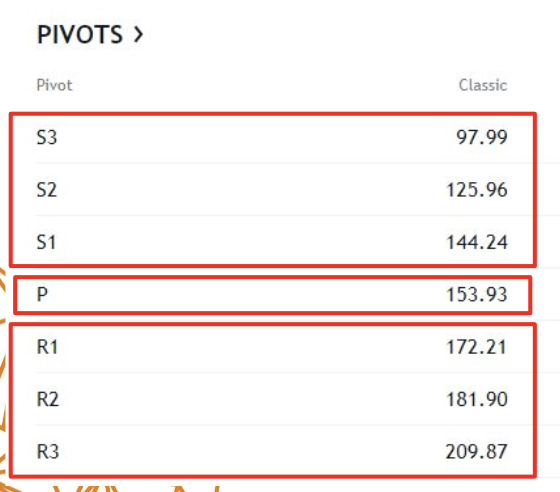
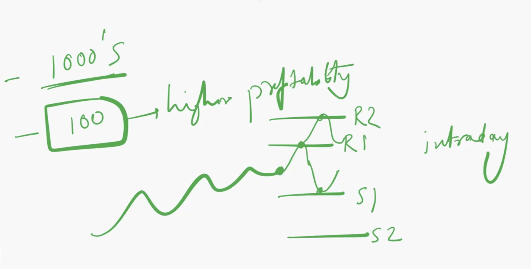
Pivot Points - To calculate S&R
Indicators
- mathematical derivations of Price / Volume
- helps in identification of patterns
- range from simple averages to complex stochastics
- assumption: trading behaviour remains same. history repeats itself
- sensitive to lookback period or window (N)
- technical, fundamental, machine learning
-
Technical indicators are generally lagging because they can only be calculated after price and volume have been established
-
Their main purpose is to identify patterns and confirm signals rather than independently predict future prices
-
Traders may construct their own indicators, provided they can explain the rationale and what the indicator measures
-
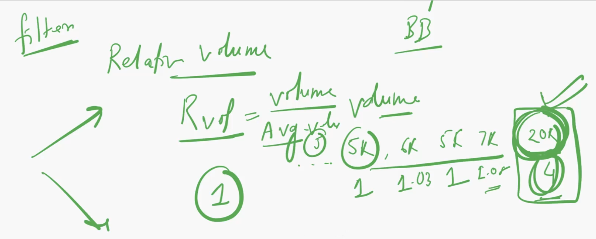
Relative volume (RVOL) compares the current trading volume with the average volume over a chosen lookback period:
- An RVOL close to 1 means volume is near its recent average; for example, a volume of 20,000 against an average of 5,000 gives an RVOL of 4
- A sharp rise in RVOL indicates unusual market interest, but does not reveal whether the price will rise or fall
- RVOL can therefore be used to filter stocks before examining price direction and other technical signals
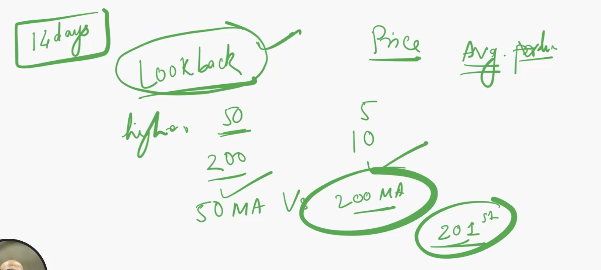
- The lookback period is the amount of historical price or volume data used to calculate an indicator
- The chosen window affects the result; for example, average volume over 5 days will differ from average volume over 10 days
- A longer lookback uses more historical information, but it also delays the first available indicator value and signal
- For a 50-day versus 200-day moving-average strategy, 200 days of data are required before the averages can be compared, so the first trading signal can only appear around the 201st day
- Fourteen periods is a common default in charting software, particularly for short-term trading, but it can be adjusted to suit the strategy and trading timeframe
- The lookback period must therefore be selected carefully rather than accepted automatically
Moving Averages
- reduces noise
- easy to interpret
- simple moving average:
- equal weights to all data
- exponential moving average:
- more weights to recent data
- slow and fast moving averages:
- time dependent
- sentiments and crossovers:
- current sentiment: shorter MA
- long term sentiment: longer MA
- crossover: current momentum
Calculate MA in Excel
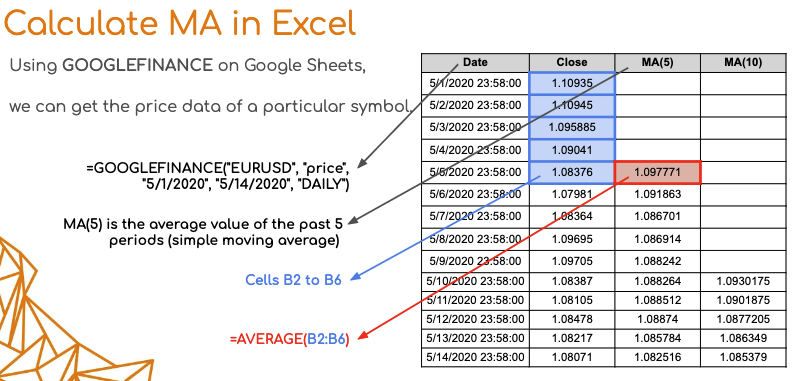
Application
- bands, crossovers, direction change, 2mA, 3 MA etc.
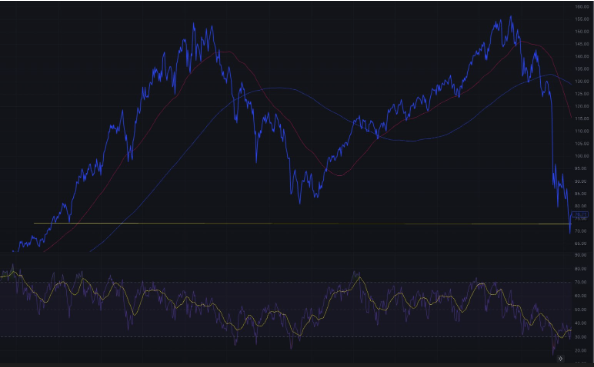
- The SPY chart covers approximately 1995 to 2009 and contains two bullish periods and two bearish periods
- Despite the large movements within the period, SPY finished near where it began, so a passive long-term investor earned little overall return across roughly 14 years
- This makes the period useful for backtesting because a strategy must operate through repeated rising and falling markets rather than only one favourable market regime
- A moving average or similar trend indicator can help identify when price support has broken, providing a signal to exit before a larger decline
- The trader can then re-enter when the indicator confirms that the upward trend has resumed
- The example shows that exiting a position is as important as entering it, even for long-term investing
- Indicators should be used with price action as confirmation tools; they do not guarantee that every exit or re-entry will be correct
Strategy Moving Averages
- 5 days vs 21 days
- MA’s can be used in many ways:
- bands / envelopes
- slope change
- 3 MA
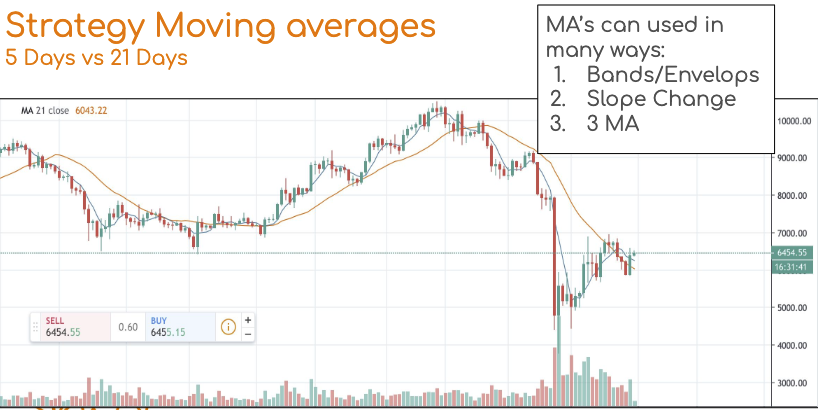
- Moving-average crossover: compare a faster moving average, such as the 5-day MA, with a slower one, such as the 21-day MA
- When the faster MA crosses above the slower MA, it indicates strengthening upward momentum and may provide a buy signal
- When the faster MA crosses below the slower MA, it indicates weakening momentum and may provide a sell or short signal
- The same method can use other windows, such as the 50-day and 200-day moving averages
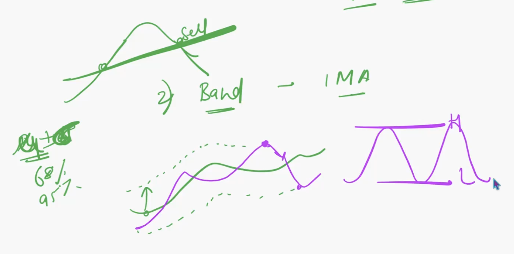
- Bands or envelopes: construct an upper and lower boundary around one moving average using a measure of dispersion, such as one or two standard deviations
- The boundaries represent a range within which the price is expected to oscillate
- A price reaching the upper band may face resistance and reverse downwards, while a price reaching the lower band may find support and reverse upwards
- This resembles Bollinger Bands, although Bollinger Bands are calculated directly from price data
- Slope change: a change in the direction of the moving-average slope suggests that momentum is weakening or reversing, even if the price has not yet clearly reversed
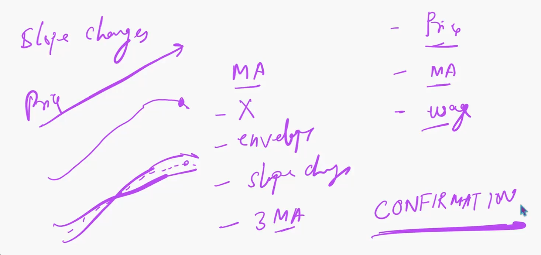
- Three moving averages: a third MA can be used to confirm the direction indicated by the first two, reducing the number of trades but increasing the probability of a reliable signal
Other Important Indicators
- RSI
- MACD
- BB
- ATR
- OBV
- ADX
RSI
-
- lookback generally 14 days
- oscillates between 0 to 100

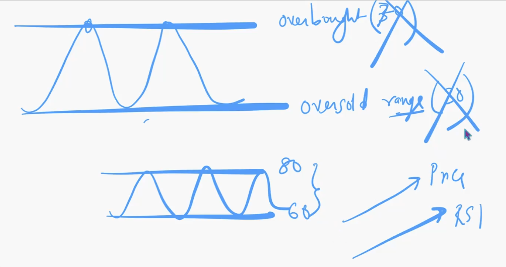
- The conventional RSI thresholds of 70 for overbought and 30 for oversold should not be applied automatically to every stock
- Identify the relevant overbought and oversold zones from the stock’s own historical RSI peaks and troughs
- For a strongly bullish stock, RSI may repeatedly oscillate between approximately 60 and 80 without falling to 30
- In such a case, 80 may act as the overbought level and 60 as the oversold level
- Because RSI is derived from average gains and losses, a rising price should normally be accompanied by a rising RSI; this confirms the price trend
- Go long: if both price and RSI are rising, RSI confirms the upward price movement and supports a long entry
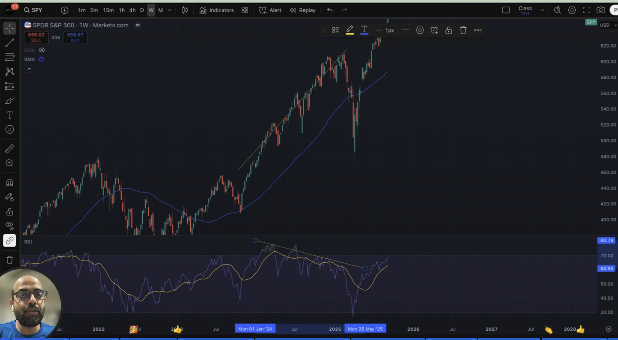
- Go long: if both price and RSI are rising, RSI confirms the upward price movement and supports a long entry
- When the price makes a new high, RSI should also make a new high
- If the price continues rising while RSI falls, a bearish divergence has formed, indicating that the upward move is losing momentum
- Wait: if price is rising while RSI is falling, do not enter a long position yet; wait for other indicators or price action to confirm the direction
- In the S&Y example, this bearish divergence was followed by a substantial price decline
- Wait: if price is rising while RSI is falling, do not enter a long position yet; wait for other indicators or price action to confirm the direction
Indicators in Python
# import all features
from ta import add_all_ta_features
# OR
# import only what you need
from ta.utils import dropna
from ta.volatility import BollingerBands
from ta.trend import ADXIndicator
from ta.volatility import AverageTrueRange
from ta.trend import SMAIndicator
from ta.momentum import RSIIndicator
from ta.volume import VolumeWeightedAveragePrice
def MovingAverage(data, window):
#initialise the indicator
## window: lookback period
C = SMAIndicator(close = data['Close'], window= window, fillna= False)
#call the sma_indicator method to get the SMA
MA = C.sma_indicator()
return round(MA,1)