See also: Pandas Glossary · R Glossary · Numpy Glossary
Python: Pandas + NumPy
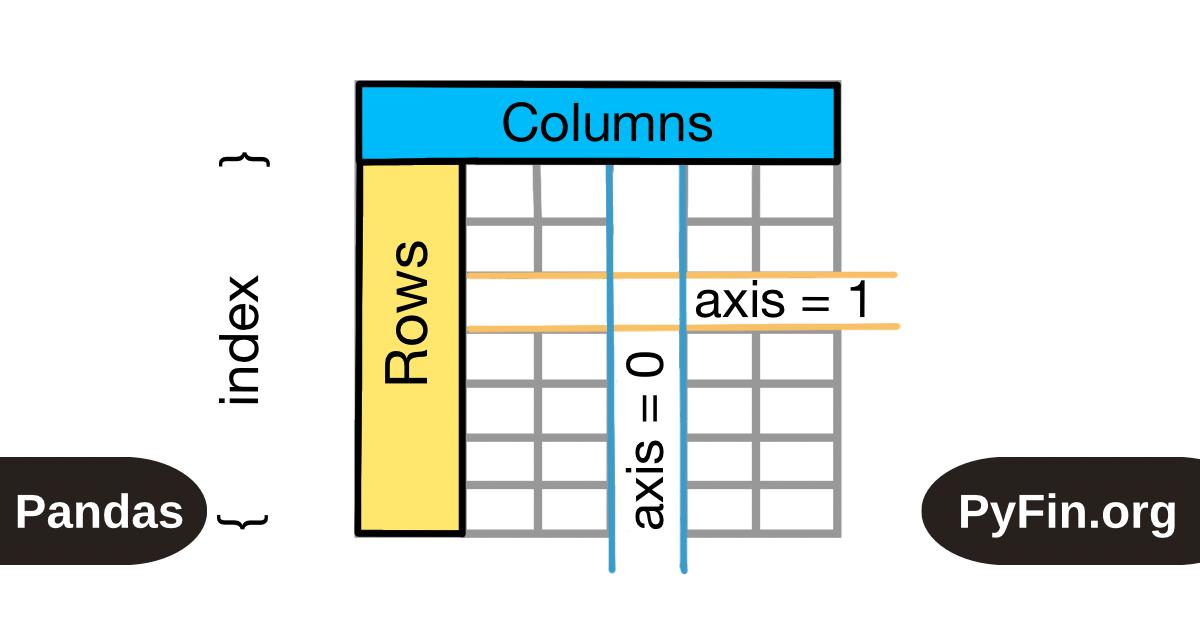
Pandas handles tabular data (DataFrames/Series). NumPy handles numerical arrays. They work together — pandas is built on top of NumPy.
Loading & Inspecting
| Function | Use Case |
|---|
pd.read_csv("file.csv") | Load CSV into a DataFrame |
pd.read_excel("file.xlsx") | Load Excel file |
df.to_csv("out.csv", index=False) | Export DataFrame to CSV |
df.head(n) / df.tail(n) | Preview first/last n rows |
df.shape | Returns (rows, columns) tuple |
df.dtypes | Data types of each column |
df.describe() | Summary stats for numeric columns |
df.info() | Column names, types, non-null counts |
Selecting & Filtering
| Function | Use Case |
|---|
df["col"] or df[["col1","col2"]] | Select column(s) |
df.loc[rows, cols] | Label-based selection (inclusive both ends) |
df.iloc[rows, cols] | Position-based selection (exclusive end) |
df[df["col"] > 5] | Filter rows by condition |
df.query("col > 5 and col2 == 'A'") | Filter using query string |
df["col"].isin([1, 2, 3]) | Filter by membership |
# loc vs iloc
df.loc[0:4, "age"]       # rows 0–4 (inclusive), column "age"
df.iloc[0:4, 2]          # rows 0–3 (exclusive end), column index 2
Cleaning & Handling Missing Data
| Function | Use Case |
|---|
df.isnull().sum() | Count missing values per column |
df.dropna() | Remove rows with any NaN |
df.fillna(value) | Replace NaN with a value |
df.drop_duplicates() | Remove duplicate rows |
df.rename(columns={"old": "new"}) | Rename columns |
df["col"].astype(int) | Change data type of a column |
pd.to_datetime(df["col"]) | Convert column to datetime |
| Function | Use Case |
|---|
df["new"] = df["a"] + df["b"] | Create new column from arithmetic |
df["col"].apply(func) | Apply a function to every element |
df["col"].map({old: new}) | Map/replace values using a dict |
df["col"].str.lower() | String operations on a column |
pd.cut(df["col"], bins=3) | Bin continuous values into categories |
# apply with lambda
df["income_k"] = df["income"].apply(lambda x: x / 1000)
Sorting & Ranking
| Function | Use Case |
|---|
df.sort_values("col") | Sort by column (ascending by default) |
df.sort_values("col", ascending=False) | Sort descending |
df["col"].rank() | Rank values within a column |
df["col"].value_counts() | Frequency count of unique values |
Grouping & Aggregation
| Function | Use Case |
|---|
df.groupby("col").mean() | Group by column and get mean |
df.groupby("col").agg({"a": "sum", "b": "mean"}) | Multiple aggregations |
df.groupby("col").size() | Count rows per group |
df.pivot_table(index="col1", values="col2", aggfunc="mean") | Excel-style pivot table |
pd.crosstab(df["col1"], df["col2"]) | Cross-tabulation frequency table |
# groupby + agg
df.groupby("department").agg(
    avg_salary=("salary", "mean"),
    headcount=("salary", "count")
)
Combining DataFrames
| Function | Use Case |
|---|
pd.concat([df1, df2]) | Stack DataFrames vertically |
pd.concat([df1, df2], axis=1) | Join DataFrames side by side |
df1.merge(df2, on="key") | Inner join on a column |
df1.merge(df2, on="key", how="left") | Left join |
df1.merge(df2, on="key", how="outer") | Full outer join |
Reshaping
| Function | Use Case |
|---|
df.melt(id_vars=["id"], value_vars=["a","b"]) | Wide → Long format |
df.pivot(index="id", columns="var", values="val") | Long → Wide format |
df.stack() / df.unstack() | Rotate columns to rows / rows to columns |
df.T | Transpose rows and columns |
NumPy: Core Functions
NumPy operates on arrays (not DataFrames). Used heavily for computation and passing data to ML models.
| Function | Use Case |
|---|
np.array([1, 2, 3]) | Create a 1D array |
np.zeros((3,3)) / np.ones((3,3)) | Create arrays of 0s or 1s |
np.arange(start, stop, step) | Evenly spaced values (like Python range) |
np.linspace(start, stop, n) | n evenly spaced values between start and stop |
arr.reshape(rows, cols) | Reshape array without changing data |
arr.ravel() / arr.flatten() | Flatten to 1D |
np.concatenate([a, b], axis=0) | Join arrays along an axis |
np.where(condition, val_if_true, val_if_false) | Conditional element replacement |
np.sort(arr) | Sort array values |
np.argsort(arr) | Return indices that would sort array |
arr[arr > 5] | Boolean indexing / filtering |
np.unique(arr) | Unique values |
np.nan / np.isnan(arr) | Handle NaN values |
Stats functions (all accept axis= argument):
| Function | Use Case |
|---|
np.mean(arr) / np.median(arr) | Mean / median |
np.std(arr) / np.var(arr) | Standard deviation / variance |
np.sum(arr) / np.cumsum(arr) | Sum / cumulative sum |
np.min(arr) / np.max(arr) | Min / max values |
np.percentile(arr, 75) | Percentile |
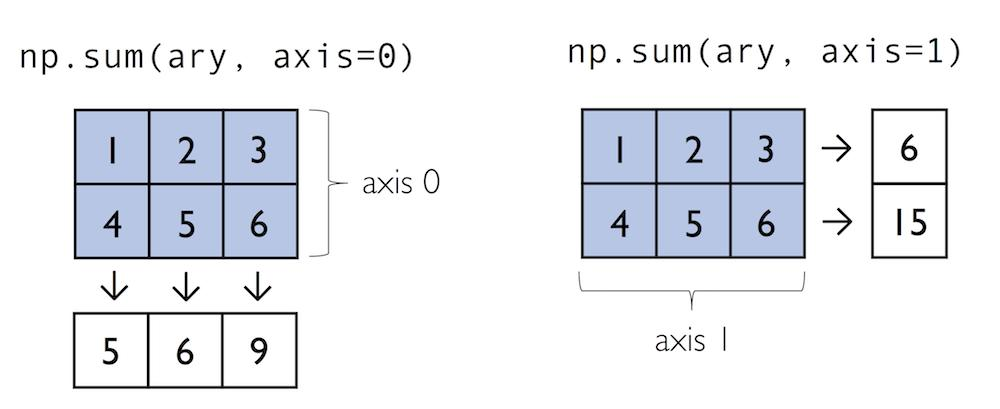
# axis= controls direction
a = np.array([[1,2],[3,4]])
np.sum(a, axis=0)   # sum down columns → [4, 6]
np.sum(a, axis=1)   # sum across rows → [3, 7]
Pandas ↔ NumPy conversion:
arr = df["col"].to_numpy()          # Series → NumPy array
arr = df.to_numpy()                 # DataFrame → NumPy array
df = pd.DataFrame(arr, columns=["a","b"])  # NumPy → DataFrame
R: Data Manipulation
The dominant workflow is the tidyverse (dplyr + tidyr). Base R functions also appear frequently.
library(tidyverse) # loads dplyr, tidyr, readr, ggplot2, etc.
The pipe operator |> (or %>%) chains operations: output of left becomes input of right.
Loading & Inspecting
| Function | Use Case |
|---|
read_csv("file.csv") | Load CSV (tidyverse; faster than base R) |
read.csv("file.csv") | Load CSV (base R) |
head(df, n) / tail(df, n) | Preview first/last n rows |
glimpse(df) | Compact column overview (tidyverse) |
str(df) | Structure of object (base R) |
summary(df) | Summary stats for all columns |
dim(df) | Rows and columns |
names(df) / colnames(df) | Column names |
dplyr: The Core Verbs
These six functions handle the vast majority of manipulation tasks.
| Function | Use Case |
|---|
filter(df, col > 5) | Keep rows meeting a condition |
select(df, col1, col2) | Keep specific columns |
mutate(df, new_col = col1 + col2) | Add or transform columns |
arrange(df, col) | Sort rows (use desc(col) to reverse) |
summarise(df, mean_val = mean(col)) | Collapse to summary values |
group_by(df, col) | Group for per-group operations |
# Chaining with pipe
df |>
  filter(age > 18) |>
  group_by(department) |>
  summarise(avg_salary = mean(salary),
            n = n())
Selecting Columns (select helpers)
select(df, starts_with("sales_"))   # columns starting with "sales_"
select(df, contains("date"))        # columns containing "date"
select(df, where(is.numeric))       # all numeric columns
select(df, -col_to_drop)            # all except one column
Other Useful dplyr Functions
| Function | Use Case |
|---|
rename(df, new = old) | Rename a column |
distinct(df, col) | Unique rows (optionally by column) |
slice(df, 1:10) | Select rows by position |
slice_sample(df, n=50) | Random sample of rows |
count(df, col) | Frequency count per group |
n() | Count rows (used inside summarise) |
case_when(...) | Vectorised if-else (inside mutate) |
coalesce(col1, col2) | First non-NA value across columns |
# case_when example
df |> mutate(grade = case_when(
  score >= 90 ~ "A",
  score >= 70 ~ "B",
  TRUE        ~ "C"
))
Joining Tables
| Function | Use Case |
|---|
inner_join(df1, df2, by="key") | Only matching rows |
left_join(df1, df2, by="key") | All rows from df1, NAs for non-matches |
right_join(df1, df2, by="key") | All rows from df2 |
full_join(df1, df2, by="key") | All rows from both |
anti_join(df1, df2, by="key") | Rows in df1 NOT in df2 |
bind_rows(df1, df2) | Stack DataFrames vertically |
bind_cols(df1, df2) | Join DataFrames side by side |
tidyr: Reshaping Data
| Function | Use Case |
|---|
pivot_longer(df, cols, names_to, values_to) | Wide → Long format |
pivot_wider(df, names_from, values_from) | Long → Wide format |
separate(df, col, into=c("a","b"), sep="-") | Split one column into two |
unite(df, "new_col", col1, col2, sep="_") | Combine two columns into one |
drop_na(df) / drop_na(df, col) | Remove rows with NAs |
replace_na(list(col = 0)) | Replace NAs with a value |
fill(df, col) | Fill NAs with previous/next value |
# Wide to long
df |> pivot_longer(
  cols = c(jan, feb, mar),
  names_to = "month",
  values_to = "sales"
)
Base R: Still Commonly Used
| Function | Use Case |
|---|
df[rows, cols] | Indexing (e.g., df[1:5, c("a","b")]) |
df$col | Access a single column |
subset(df, col > 5) | Filter rows |
which(condition) | Indices where condition is TRUE |
table(df$col) | Frequency table |
tapply(x, group, fun) | Apply function by group |
apply(m, margin, fun) | Apply function over rows (1) or cols (2) |
is.na(x) / na.omit(x) | Check/remove NAs |
order(df$col) | Get sort order indices |
paste(a, b, sep="-") | Concatenate strings |
Quick Comparison: Python vs R
| Task | Python (pandas) | R (dplyr) |
|---|
| Filter rows | df[df["age"] > 18] | filter(df, age > 18) |
| Select columns | df[["a", "b"]] | select(df, a, b) |
| Add column | df["new"] = df["a"] * 2 | mutate(df, new = a * 2) |
| Sort | df.sort_values("col") | arrange(df, col) |
| Group + summarise | df.groupby("g").mean() | group_by(df, g) |> summarise(mean(x)) |
| Wide → Long | df.melt(...) | pivot_longer(...) |
| Long → Wide | df.pivot(...) | pivot_wider(...) |
| Join | df1.merge(df2, on="key") | inner_join(df1, df2, by="key") |