Purpose:
- Measuring HOW STRONG an association is (chi-square only tells you IF one exists)
Probability vs Odds
| Concept | Formula | Range | Example (30/100 recover) |
|---|---|---|---|
| Probability | successes / total | 0 to 1 | 30/100 = 0.30 |
| Odds | successes / failures P / (1-P) | 0 to ∞ | 30/70 ≈ 0.43 |
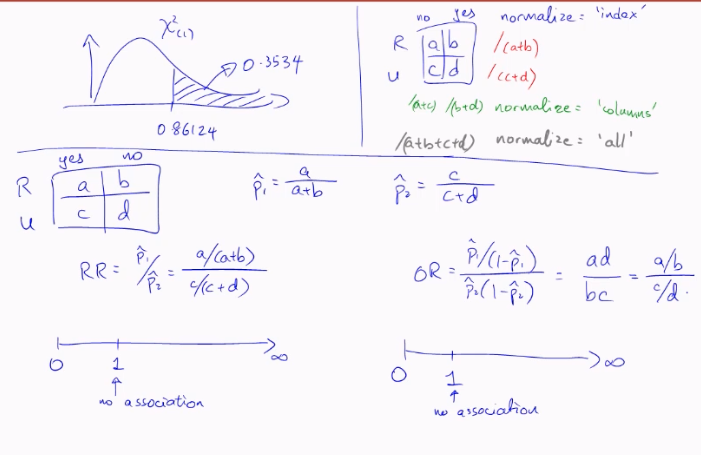
Relative Risk (RR)
Key Idea
“How many times more likely is the outcome in Group 1 vs Group 2?”
Formula
RR = P(outcome | Group 1) / P(outcome | Group 2)
Interpretation
| RR | Meaning |
|---|---|
| RR = 1 | No difference |
| RR = 2 | Group 1 has double the risk |
| RR = 0.5 | Group 1 has half the risk |
Odds Ratio (OR)
Key Idea
“How many times higher are the ODDS in Group 1 vs Group 2?”
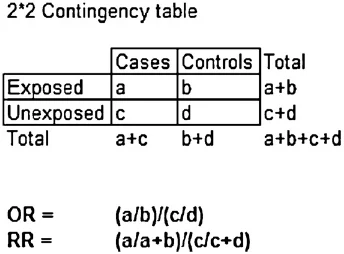
Formula (2×2 table shortcut)
         Outcome   No Outcome
Group 1     a          b
Group 2     c          d

OR = (a × d) / (b × c)
Interpretation
| OR | Meaning |
|---|---|
| OR = 1 | No association |
| OR > 1 | Group 1 has higher odds |
| OR < 1 | Group 1 has lower odds |
RR vs OR: When Do They Differ?
- Rare outcome (< 10%): RR ≈ OR — either works
- Common outcome (> 10%): They diverge — RR is more intuitive
| Study Design | Use |
|---|---|
| Cohort (follow over time) | RR |
| Case-control | OR (can’t calculate RR) |
| Cross-sectional | Either |
Confidence Intervals
Magic number = 1.0 (means no association)
- CI excludes 1.0 → association is significant (p < 0.05)
- CI includes 1.0 → cannot conclude there’s an association
Python (OR + 95% CI)
import numpy as np

a, b, c, d = 60, 40, 30, 70

# Relative Risk
RR = (a/(a+b)) / (c/(c+d))

# Odds Ratio
OR = (a * d) / (b * c)

# 95% CI for OR
log_or = np.log(OR)
se = np.sqrt(1/a + 1/b + 1/c + 1/d)
ci_lower = np.exp(log_or - 1.96 * se)
ci_upper = np.exp(log_or + 1.96 * se)

print(f"RR = {RR:.4f}")
print(f"OR = {OR:.4f}, 95% CI: [{ci_lower:.4f}, {ci_upper:.4f}]")
What to Report
Relative Risk:
“The risk of outcome was 2.3 times higher in the exposed group (RR = 2.3, 95% CI [1.5, 3.6], p = 0.002).”
Odds Ratio:
“Exposure was associated with increased odds of outcome (OR = 2.8, 95% CI [1.4, 5.7], p = 0.004).”