This is very much tied in with Bonds
Definition:
- a yield curve is a graphical representation of yields over time
- it’s often depicted by plotting the yield of any given bond across different maturities in a given interval, perhaps by month
- plots the yields or interest rates of bonds that have equal credit quality but different maturity dates
- the slope of the curve predicts the direction of interest rates and the economic expansion or contraction that could result
How it works:
- is a benchmark for other debts in the market, such as mortgage rates and bank lending rates
- some investors use it to make investment decisions based on the likely direction of bond rates
Types of Yield Curves
1. Normal Yield Curve:
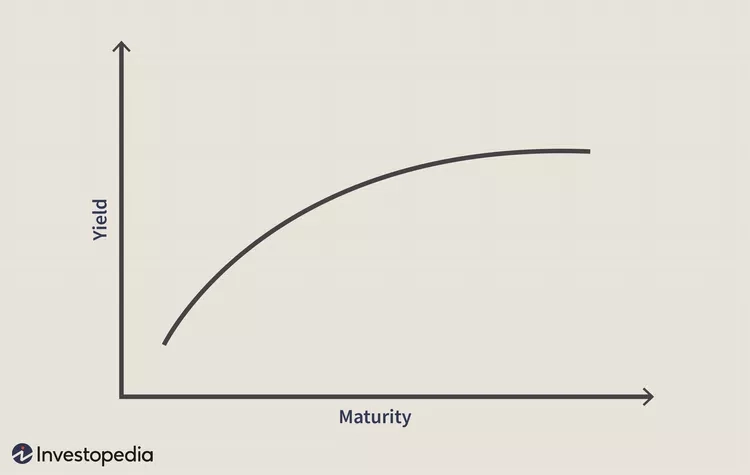
- shows low yields for shorter-maturity bonds, increasing for bonds with a longer maturity
- the curve slopes upward, indicating that yields on longer-term bonds continue to rise, responding to periods of economic expansion
- some bond investors will use a roll-down return strategy and sell a bond as it moves toward its maturity date
- “riding the curve”
- works in a stable rate environment as the bond’s yield falls and the price rises
- investors hope to capture profit from the rise in bond prices
2. Inverted Yield Curve:
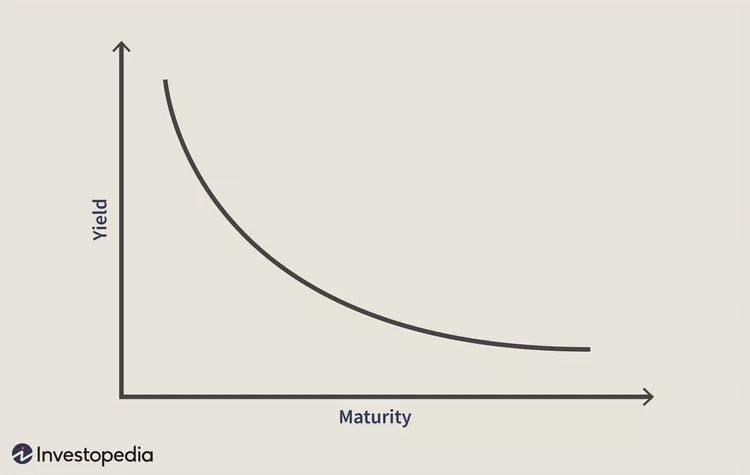
- slopes downward with short-term interest rates exceeding long-term ones
- (is rare) appears during recessions, when investors expect long-term bond yields to drop
- investors seeking safe investments in an economic downturn tend to choose longer-dated bonds over short-dated ones, bidding up the price of longer bonds and driving down their yield
3. Flat Yield Curve:
- shows similar yields across all maturities, implying economic uncertainty
- a few intermediate maturities may have slightly higher yields that cause a slight hump to appear along the flat curve
- these humps are usually for mid-term maturities of six months to two years
- in times of uncertainty, investors demand similar yields across all maturities
What is a US Treasury Yield Curve?
- allows for the comparison of the yields of short-term treasury bills and the yields of long-term treasury notes and bonds
- shows the relationship between the interest rates and the maturities of US Treasury fixed-income securities
What is Yield Curve Risk?
- refers to the adverse effect of a shift in interest rates on the returns from fixed-income instruments like bonds
- stems from the fact that bond prices and interest rates have an inverse relationship to each other
- price of bonds in secondary market decrease when market interest rates increase and vice versa
How can investors used the yield curve?
- eg. an investor might move their money into defensive assets that traditionally do well during a recession if the bond yield curve indicates an economic slowdown
- might avoid long-term bonds with a yield that will erode against increase prices if the yield curve becomes steep, suggesting future inflation