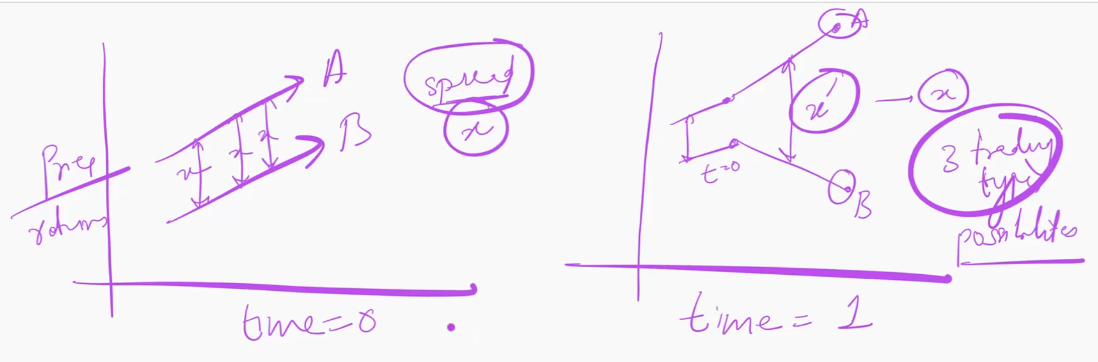
At t=0, highly correlated stocks A and B move in tandem and maintain a roughly constant spread, x.
At t=1, A rises while B falls, causing the spread to widen to x′.
This temporary deviation is the potential trading opportunity, provided the relationship has not changed fundamentally.
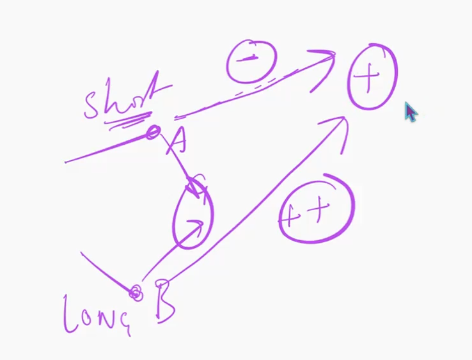
The spread can return to normal in three ways:
A continues rising while B rises faster to catch up.
B continues falling while A falls faster to catch up.
A falls and B rises, so both positions converge toward each other.
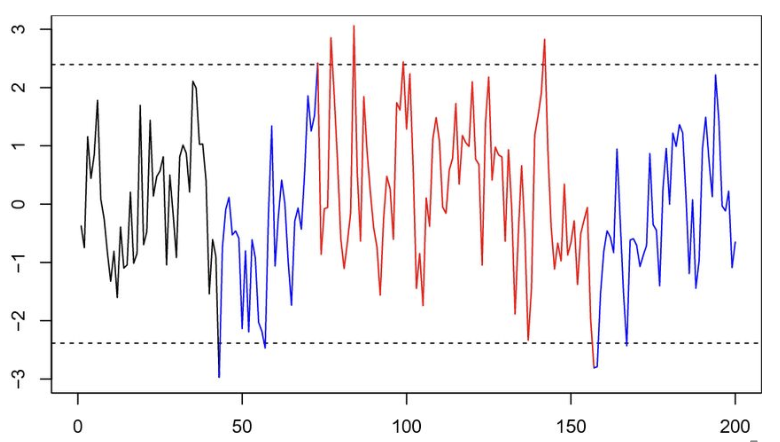
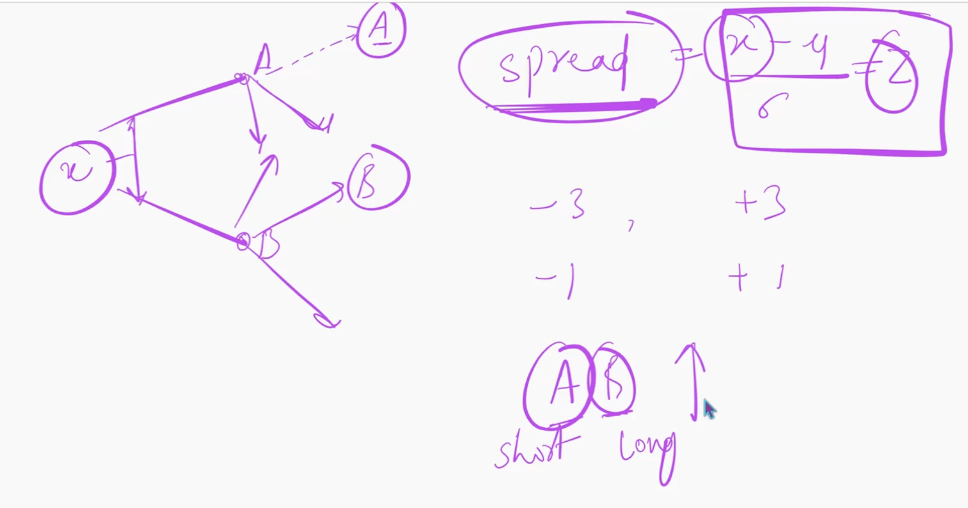
Track the spread over time and standardise it using the z-score, z=σx−μ, which measures how many standard deviations the current spread is from its mean.
A large absolute z-score indicates a larger deviation and hence a stronger potential mean-reversion opportunity.
When A is unusually high relative to B, short A and long B simultaneously; this avoids taking a naked directional position.
Convergence does not require both trades to be profitable: the gain on the stock moving more strongly toward convergence should exceed the loss on the other position.
The strategy fails if the stocks have diverged for fundamental reasons rather than because of a temporary market inefficiency.
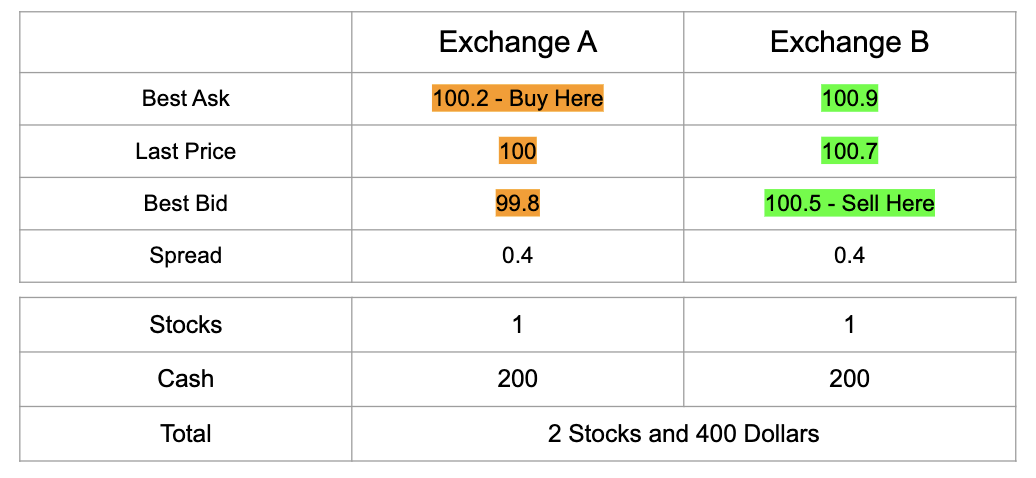
Arbitrage
buy at cheaper exchange and sell at expensive exchange
Grid Trading
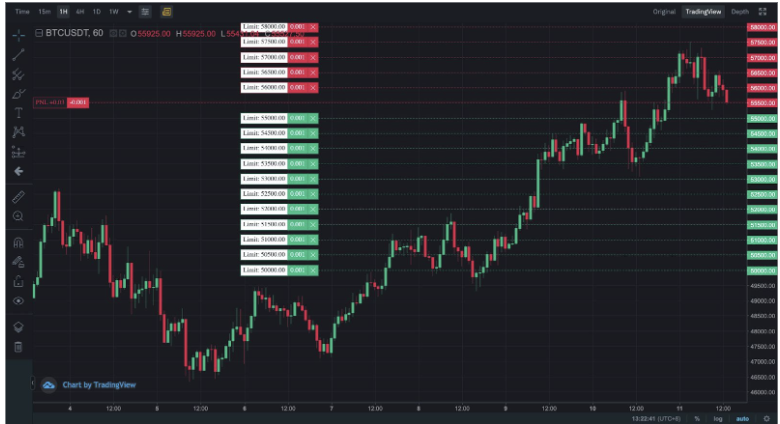
place both “buy” and “sell” orders in a range
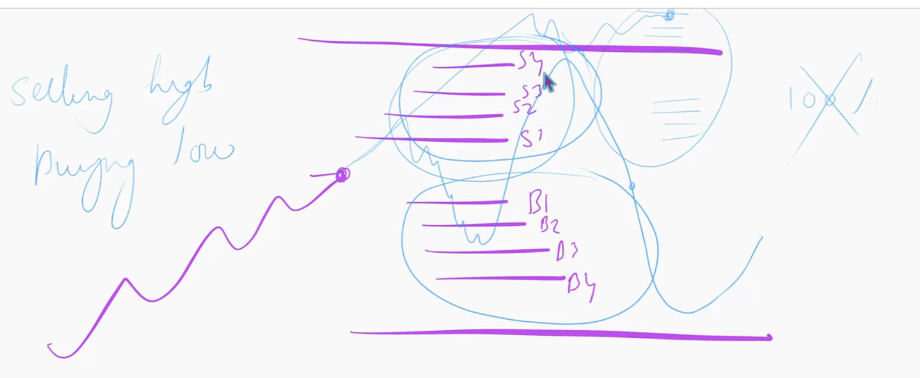
Grid trading is suited to range-bound, mean-reverting instruments such as forex pairs: although prices are volatile, they tend to return to a recurring range.
Place several sell limit orders above the current price (S1,S2,…) and several buy limit orders below it (B1,B2,…).
This is not a directional or momentum bet: the trader does not predict whether price will first rise or fall, only that it will continue oscillating within the range.
The grid boundaries can be informed by the probability bands from return projections (e.g. the expected 68% or 95% price range).
As price fluctuates through the grid, the orders are filled at different levels, repeatedly selling high and buying low.
The key risk is a sustained breakout: if price keeps rising after the sell orders execute, or keeps falling after the buy orders execute, it may never return to fill the opposite side profitably.
Manage this risk by allocating only part of the capital to grid trading and diversifying with a trend-following strategy, which may profit when the range breaks into strong momentum.
Once a grid has completed, or price has moved to a new area, rebalance and reset a new grid around the prevailing range with appropriate risk limits.
Candlestick Patterns
Bullish candlestick patterns
hammer
inverted hammer
bullish engulfing
morning star
piercing line
three white soldiers
Bearish candlestick patterns
shooting star
hanging man
bearish engulfing
evening star
dark cloud cover
three black crows
others:
doji
spinning top
rising three methods
falling three methods
bullish harami
bearish harami
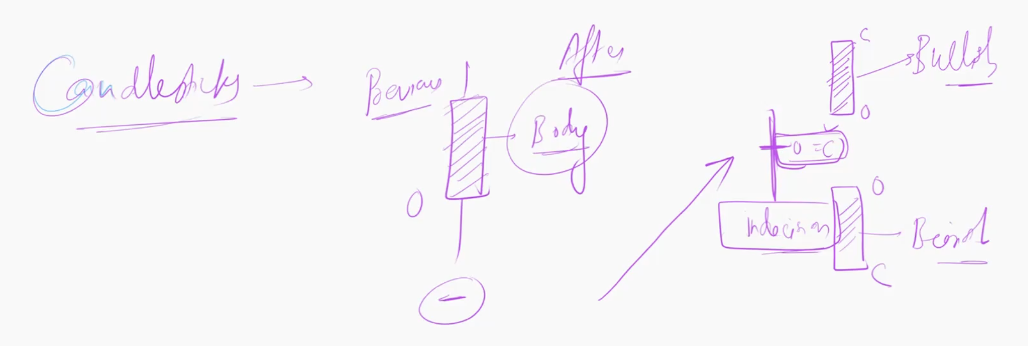
The candlestick body, determined by the open and close, helps reveal trader sentiment. Its size indicates the strength of buying or selling pressure.
A candlestick should not usually be interpreted alone. Read it in the context of the preceding trend and wait for the following candle when confirmation is needed.
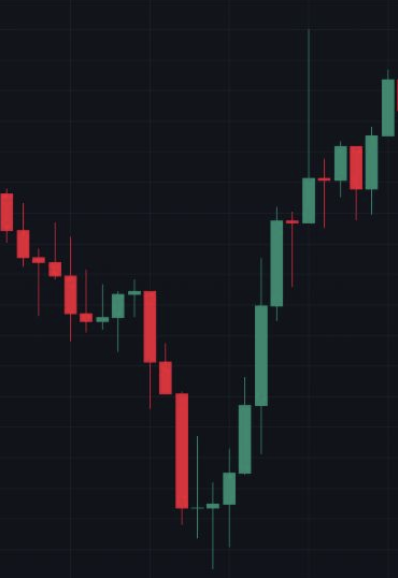
In the example, price has been moving upward before a doji appears. The doji has approximately equal open and close prices, so its body is very small.
The doji represents market indecision, not an automatic reversal signal.
Wait for the next candle to clarify the market’s direction:
a bullish candle suggests a bullish move or continuation;
a bearish candle suggests a possible bearish move or reversal.
Confirm candlestick signals using the broader trend, technical indicators, or relevant fundamental information before making a trading decision.